We have discussed extensively about false sharing on this blog. In our last post Why Ring Buffers Outperform ArrayBlockingQueue: Understanding the Performance Gap, we did a deep dive into ring buffers and ArrayBlockingQueue, and why ring buffers often outperform ArrayBlockingQueue.
Now, while writing that post, there was one thing we mentioned that keeps coming back, and if you already understand false sharing, you will immediately see why it looks suspicious.
Inside ArrayBlockingQueue, you have these two fields:
    /** items index for next take, poll, peek or remove */
    int takeIndex;

    /** items index for next put, offer, or add */
    int putIndex;
If you are familiar with false sharing, this looks like the perfect recipe for it.
But is it really?
ArrayBlockingQueue uses one single lock for both producers and consumers. So in theory, producers and consumers are not modifying these fields at the same time. It is basically one thread at a time touching these pointers.
So does false sharing still happen here or not?
That is exactly what we are investigating in this blog post. We will show how this object is actually laid out in memory, investigate cache line contention and cache misses, build a custom padded version of ArrayBlockingQueue (same logic, better layout), and finally run benchmarks against the JDK ArrayBlockingQueue.
Revealing the Memory Layout with JOL
First, let’s investigate the object’s memory layout. How are fields inside ArrayBlockingQueue actually arranged in heap memory?
Java doesn’t expose this natively, so we use Java Object Layout (JOL) from OpenJDK. JOL digs into JVM internals and prints the stuff Java normally hides: object headers, field offsets, sizes, alignment, and any padding the JVM inserts.
Installing and Using JOL
Add this dependency to your pom.xml:
<dependency>
    <groupId>org.openjdk.jol</groupId>
    <artifactId>jol-core</artifactId>
    <version>0.17</version>
</dependency>
Now run this code to inspect the layout:
import org.openjdk.jol.info.ClassLayout;
import java.util.concurrent.ArrayBlockingQueue;

public class ABQLayout {
    public static void main(String[] args) {
        ArrayBlockingQueue<String> queue = new ArrayBlockingQueue<>(1024);
        System.out.println(ClassLayout.parseInstance(queue).toPrintable());
    }
}
And run it like this:
mvn -q exec:java -Dexec.mainClass=com.heappulse.ABQLayout
Reading the JOL Output
Here’s a formated version of the output from JOL dump:
OFF  SZ   TYPE   DESCRIPTION
 0   8          (object header: mark)
 8   4          (object header: class)
12   4   int    takeIndex
16   4   int    putIndex
20   4   int    count
24   4   Object[] items
28   4   ReentrantLock lock
32   4   Condition notEmpty
36   4   Condition notFull
40   4   Itrs itrs
44   4          (object alignment gap)
Instance size: 48 bytes
This result shows that :
takeIndex,putIndex, andcountare packed back-to-back.- Their offsets are: 12, 16, 20.
- Each is 4 bytes, so together they occupy 12 bytes total.
- And the whole
ArrayBlockingQueueobject is just 48 bytes.
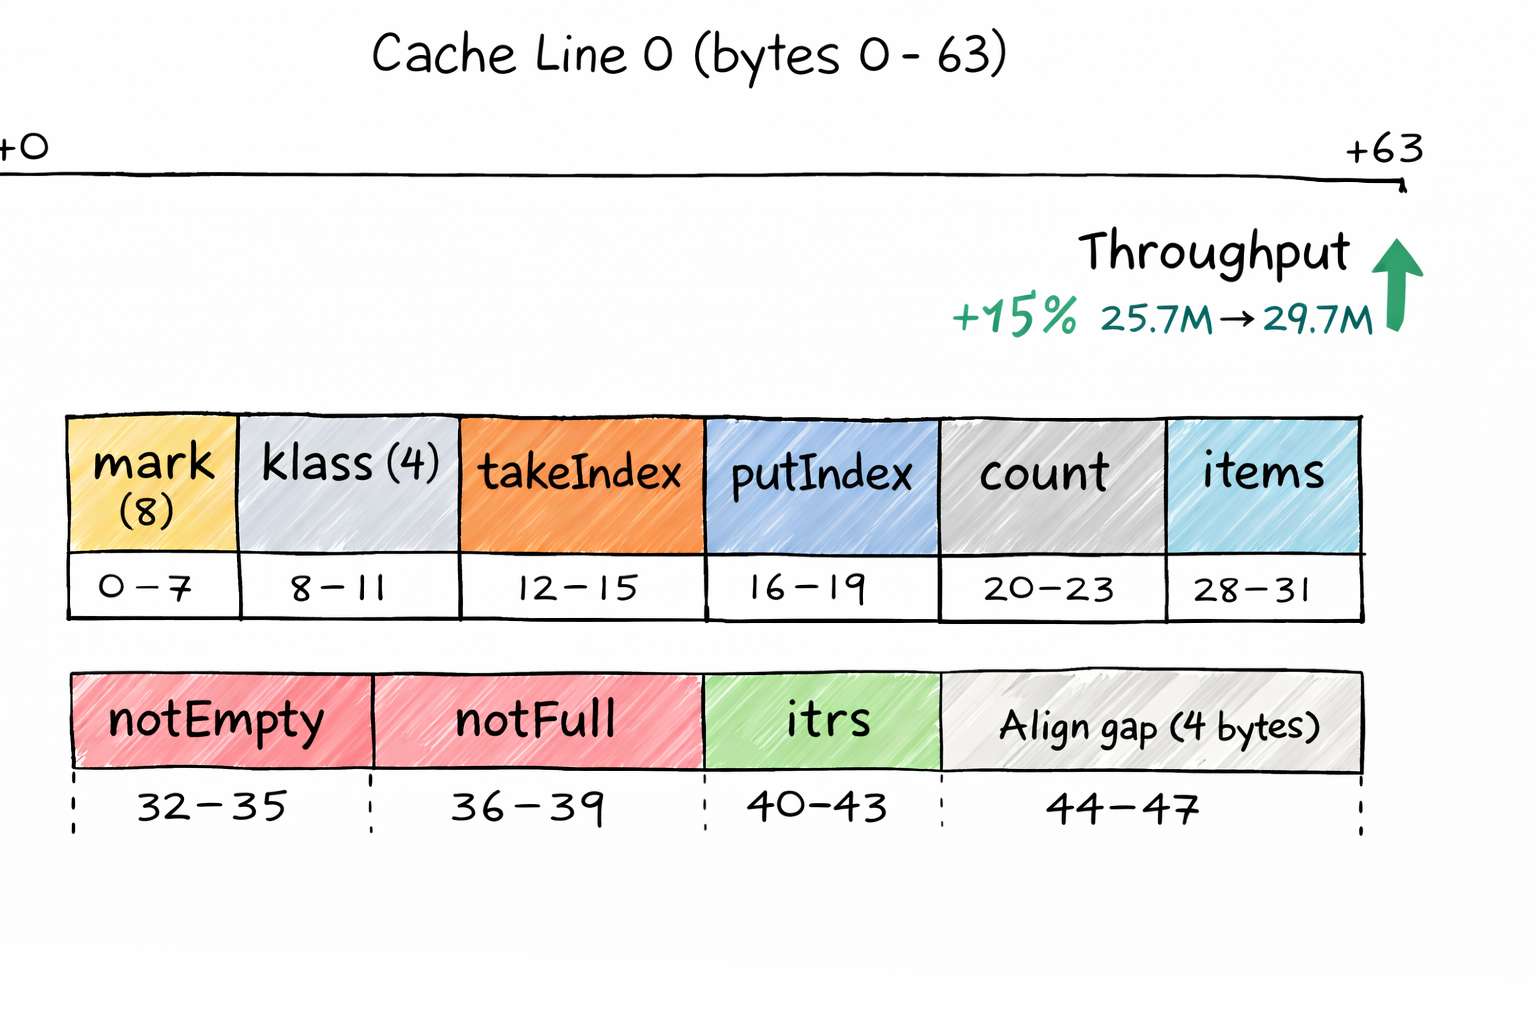
Most CPUs have 64-byte cache lines. So, drawing the first cache line for this object will look somethign like this: (bytes 0 to 63).
Cache Line 0 (bytes 0 - 63)

+0                                                                  +63
|---------------------------------------------------------------------|
| mark (8) | klass (4) | takeIndex | putIndex | count | items | lock  |
|   0-7    |   8-11    |  12-15    |  16-19   | 20-23 | 24-27 | 28-31 |
|---------------------------------------------------------------------|
| notEmpty | notFull   | itrs      |  align gap (4 bytes)             |
|  32-35   |  36-39    |  40-43    |  44-47                           |
|---------------------------------------------------------------------|
If you understand false sharing, this this is where the suspicion comes from:
- Consumers mostly write
takeIndexandcount. - Producers mostly write
putIndexandcount.
And since these live close together, they can easily share the same cache line.
Implementing a Padded ArrayBlockingQueue
It is now clear to us that takeIndex, putIndex, and count are literally sitting back-to-back in memory, inside the same cache line. We now build a simple padded version of ArrayBlockingQueue. Here is a small snippet of what it looks like:
public final class PaddedArrayBlockingQueue<E>
        extends AbstractQueue<E>
        implements BlockingQueue<E> {

    final Object[] items;
    final ReentrantLock lock;
    final Condition notEmpty;
    final Condition notFull;

    // Hot fields, now isolated onto different cache lines
    @Contended("take")
    int takeIndex;

    @Contended("put")
    int putIndex;

    @Contended("count")
    int count;

    public PaddedArrayBlockingQueue(int capacity) {
        if (capacity <= 0) throw new IllegalArgumentException();
        this.items = new Object[capacity];
        this.lock = new ReentrantLock(false);
        this.notEmpty = lock.newCondition();
        this.notFull = lock.newCondition();
    }

    @Override
    public void put(E e) throws InterruptedException { /* same as ABQ */ }

    @Override
    public E take() throws InterruptedException { /* same as ABQ */ }

    // ...
}
Demonstrating Cache Line Contention
Profiling with perf (Linux): Capturing Cache Misses and Sharing Events
Next we’ll use Linux perf to see what the CPU reports while the queue is under load: cache references, cache misses, plus basic noise signals like context switches and CPU migrations. We’ll pin producer/consumer threads to fixed cores, then repeat the same run with a padded queue and compare the counters.
Here is our workload:
import java.util.concurrent.ArrayBlockingQueue;

public class ABQContention {

  static volatile boolean running = true;

  public static void main(String[] args) throws Exception {
    int capacity = 1024;
    int producers = 2;
    int consumers = 2;
    int seconds = 20;

    var q = new ArrayBlockingQueue<Integer>(capacity);

    // Start half-full so both put() and take() are active immediately
    for (int i = 0; i < capacity / 2; i++) q.put(1);

    Runnable producer = () -> {
      while (running) {
        try { q.put(1); } catch (InterruptedException ignored) {}
      }
    };
    Runnable consumer = () -> {
      while (running) {
        try { q.take(); } catch (InterruptedException ignored) {}
      }
    };

    for (int i = 0; i < producers; i++) new Thread(producer, "producer-" + i).start();
    for (int i = 0; i < consumers; i++) new Thread(consumer, "consumer-" + i).start();

    Thread.sleep(seconds * 1000L);
    running = false;
  }
}
Build and run (pinned)
Build your code with:
mvn -q -DskipTests package
Now run it pinned:
taskset -c 0,2,4,6 java -cp target/classes com.heappulse.ABQContention
Here I explicitly pin the process to CPUs 0,2,4,6 based on my machine. I picked these because they are the physical cores (not the hyper-thread “sibling” cores)
Profile with perf stat
Now profile it with perf:
sudo taskset -c 0,2,4,6 perf stat -r 5 \
  -e cycles,instructions,cache-references,cache-misses,context-switches,cpu-migrations \
  -- java -cp target/classes com.heappulse.ABQContention
We use same command to run the padded version but before that in our class ABQContention simply replace ArrayBlockingQueue with PaddedArrayBlockingQueue. Rebuild and rerun the perf command.
Perf result interpretation
From our results, the padded version shows some improvements: cache references dropped from about 4.13B → 3.96B, and cache misses dropped from about 201M → 174M, bringing the miss rate from ~4.88% → ~4.40%. While this may not be very significant, it shows that with padding the hot fields were getting in each other’s way less, so the CPU spent less time reloading the same cache line and more time actually running the queue logic.
JMH Benchmark
Also, we run a simple benchmark for both versions. Here’s the code:
@BenchmarkMode(Mode.Throughput)
@OutputTimeUnit(TimeUnit.SECONDS)
@Warmup(iterations = 5, time = 2, timeUnit = TimeUnit.SECONDS)
@Measurement(iterations = 7, time = 2, timeUnit = TimeUnit.SECONDS)
@Fork(value = 3, jvmArgsAppend = {
        "--add-exports=java.base/jdk.internal.vm.annotation=ALL-UNNAMED",
        "-XX:-RestrictContended",
        "-XX:ContendedPaddingWidth=64"
})
@State(Scope.Group)
public class AbqVsPaddedSpscBenchmark {

    @Param({"1024", "65536"})
    int capacity;

    @Param({"JDK_ABQ", "PADDED_ABQ"})
    String impl;

    @Param({"false"})
    boolean fair;

    static final Integer ITEM = 1;

    BlockingQueue<Integer> q;

    @Setup(Level.Iteration)
    public void setup() throws Exception {
        q = impl.equals("JDK_ABQ")
                ? new ArrayBlockingQueue<>(capacity, fair)
                : new PaddedArrayBlockingQueue<>(capacity, fair);
        for (int i = 0; i < capacity / 2; i++) q.put(ITEM);
    }

    @Benchmark
    @Group("q")
    @GroupThreads(1)
    public void producer() throws Exception {
        q.put(ITEM);
    }

    @Benchmark
    @Group("q")
    @GroupThreads(1)
    public void consumer(Blackhole bh) throws Exception {
        bh.consume(q.take());
    }
}
Build your code with mvn -q -DskipTests clean package and run with java -jar target/benchmarks.jar AbqVsPaddedSpscBenchmark
JMH result interpretation (SPSC)
In SPSC, the padded version consistently beats the JDK ArrayBlockingQueue. For capacity=1024 the queue throughput goes from about 25.7M ops/s → 29.7M ops/s (roughly +15%).
For capacity=65536 it goes from about 26.1M ops/s → 28.9M ops/s (roughly +11%).
Concluson
As we’ve seen in this post, padding gives a small but real improvement. ArrayBlockingQueue doesn’t suffer from the usual “classic” false sharing, because the single lock means producers and consumers aren’t updating takeIndex and putIndex at the exact same time. But those counters still sit on the same cache line, so when threads run on different cores, that cache line keeps getting passed around between cores every time the lock switches hands. Padding reduces this cache-line shuffling, and that’s why we see the improvements.
However, it’s important to note that the real cost is still the locking mechanism, most of the time is spent waiting to acquire the lock.